Utilising Tableau’s R functions opens up Tableau to R’s wealth of statistical libraries & functions. If you find yourself using Tableau & R frequently, this is the post for you!
An example of how we have utilised Tableau’s R functions is optimising marketing spend; where previously we might have had to create a very large array of the possible solutions to connect to in Tableau, using R in Tableau allowed us to optimise based on a small array of the marketing parameters that we could feed to one of R’s optimisation algorithms. This setup significantly streamlined the marketing spend optimisation process and improved the overall spend optimisation performance.
The barrier to entry is low, and only has the following software pre-requisites:
- R – https://rstudio.com/products/rstudio/download/
- Tableau (v 8.1 or later)
- Rserve package installed on the server/local machine (install using R):
- open RStudio
- type install.packages(‘RServe’) in console
This post will run through how to start using R in Tableau. By the end of the blog, you should have an understanding of how to connect to R in Tableau and how to utilise Tableau’s R functions.
- Setting up the Rserve connection
- Tableau’s R functions
- Using Tableau’s R functions
- Applying functions to columns
- Applying functions to specific rows
N.B. Tableau’s R functions are not without limitations; workbooks that contain R scripts cannot be published to Tableau Online, Tableau Public, and Tableau Reader
1. Setting up the Rserve connection
Open Rstudio and type the following commands in the console:
library(Rserve)
Rserve()
This will install and initiate a local instance of Rserve() that Tableau will connect to. You can specify the port as an argument of the Rserve function, e.g. Rserve (port = XXXX), otherwise it will be set to the default (6311). To connect to the Rserve instance, navigate to the External Service Connection window in Tableau:
Help -> Settings and Performance -> Manage External Service Connection
If connecting to a local instance of Rserve, the external service connection setting should be set to the following:
Server: localhost
Port: 6311 (unless specified otherwise)
Tableau is now configured to run R scripts.
N.B. you will have to initiate an Rserve connection and run through the external service connection each time you reopen Tableau.
2. Tableau’s R Functions
To call R in Tableau, you can use 1 of 4 functions:
- script_real: if the values to be returned are numeric
- script_boolean: if the values to be returned are True/False
- script_int: if the values to be returned are integers
- script_str: if the values to be returned are strings
The functions take the form:
script_*(‘insert r code here’, arg1, arg2…)
Using these functions opens up the entire set of R packages to Tableau, as long as they are installed on the local machine/server. The functions are table calculations, meaning that the arguments used must be aggregated – sum(), min(), max(), attr()…
The arguments are called within the R code using ‘.argN’. The arguments are vectors and can be treated within the R code as such.
Writing the script within Tableau can be unwieldy as it is difficult to view what is happening line-by-line. The recommended workflow is to write the script in your preferred IDE and transpose to Tableau.
3. Using Tableau’s R Functions
This section will run through a couple of trivial examples using the R functions.
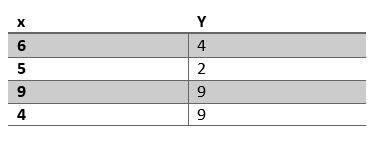
The only set-up required for the following examples was to connect to a csv in Tableau. The csv has the following structure:

N.B when working with R in Tableau, ensure that output data maintains the same order as the input data. It can be useful to read in an index alongside the arguments to help ensure the data retains the correct order.
a. Applying functions to columns
This example reads in two measures, x and y. A function is defined that multiplies two passed arguments. The value returned by the function is the output of the script.
Calculated field, z:
SCRIPT_int('
example_function <- function(x,y) {x*y}
example_function(.arg1,.arg2)',
ATTR([x]),ATTR([y]))
Here we use SCRIPT_int as the expected output is an integer. The output, column ‘z’, is shown below:

N.B The last line of the R script is treated as the output. If you were to type 1 as the last line, z would then populate with a 1 for each row.
b. Applying functions to specific rows
As with the first example, this example reads in two measures, x and y. A function is defined that multiplies two arguments. Another function is defined that divides the first argument by the second argument. The first function is applied to all rows, the second function is only applied to the third row.
SCRIPT_int('
example_function <- function(x,y) {x*y}
example_function_2 <- function(x,y) {x/y}
z = example_function(.arg1,.arg2)
z[3] = example_function_2(.arg1[3],.arg2[3])
z',
ATTR([x]),ATTR([y]))
The last line of the R script is just the vector z. Without specifying z at the end of the script, the script would return the last line z[3]…, meaning that z would be populated with 1 (x[3]/y[3]).

Closing remarks
Both R and Tableau are useful tools in their own right. However, by combining them we bring together the visualisation flexibility of Tableau and the statistical power of R. Hopefully this post provides the background required to utilise the R functions in Tableau.
If you think using R in Tableau will be useful for your business, but are unfamiliar with Tableau or R, please contact us at info@lynchpin.com, we’d be happy to chat.
About the author
Sam Clements
Sam has a degree in Natural Science and a master’s degree in Renewable Energy Engineering. As Data Science Manager at Lynchpin, Sam works on a broad range of projects across industries including Travel, Financial Services and Pharmaceuticals.
Specialising in marketing attribution, Sam utilises a range of languages (Python, R), web analytics platforms (Adobe and Google Analytics), cloud platforms (AWS, GCP), and reporting tools (Tableau, Power BI) to develop bespoke end-to-end models covering the mapping of customer journeys, spend optimisation & scenario planning.


