Introduction
In this piece of analysis, I wanted to find out if a machine could interpret a film in a similar way to a human with only the script text as entry and by applying machine learning techniques. I wanted to see if the machine could correctly identify the film’s main characters, main relationships, strength of relationships between its characters, and if there were any subplots throughout the film.
This project was done for BIMA – Edinburgh May 2018. Originally, it was going to be the same analysis using the “Top Bants” chat data (our internal company WhatsApp group) but most of the audience were probably more aware of the characters in Pulp Fiction than in Lynchpin! I was also considering doing the Lord of the Rings trilogy but my lord that was far too big.
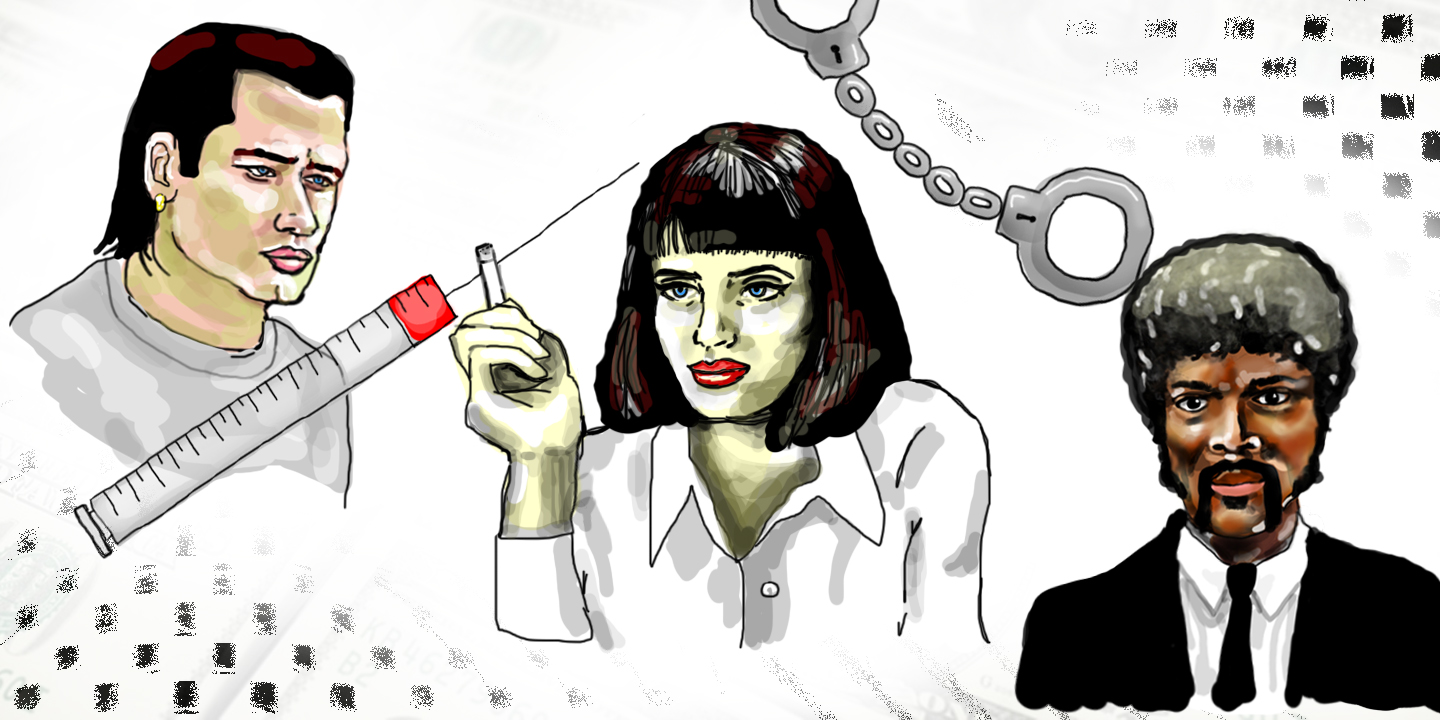
About Pulp Fiction: Directed by Quentin Tarantino in 1994, Pulp Fiction follows “The lives of two mob hitmen, a boxer, a gangster’s wife, and a pair of diner bandits [..] in four tales of violence and redemption” and currently ranks 8th highest in IMDB’s top movies of all time.
I was interested in seeing if it was possible to answer the following questions about the film using only data:
- Who are the key characters in Pulp Fiction?
- Which characters have the strongest relationships?
- Can subplots be identified?
Main characters as per the IMDB synopsis:

• Vincent & Jules – The hitmen
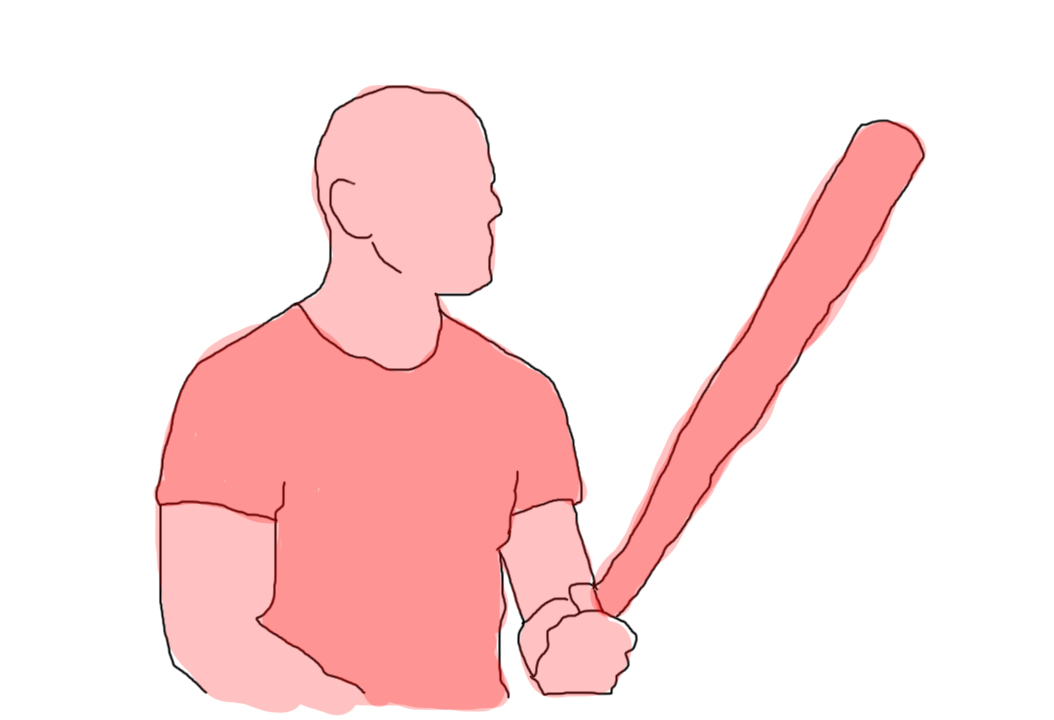
• Butch – The boxer

• Mia – The gangster’s wife
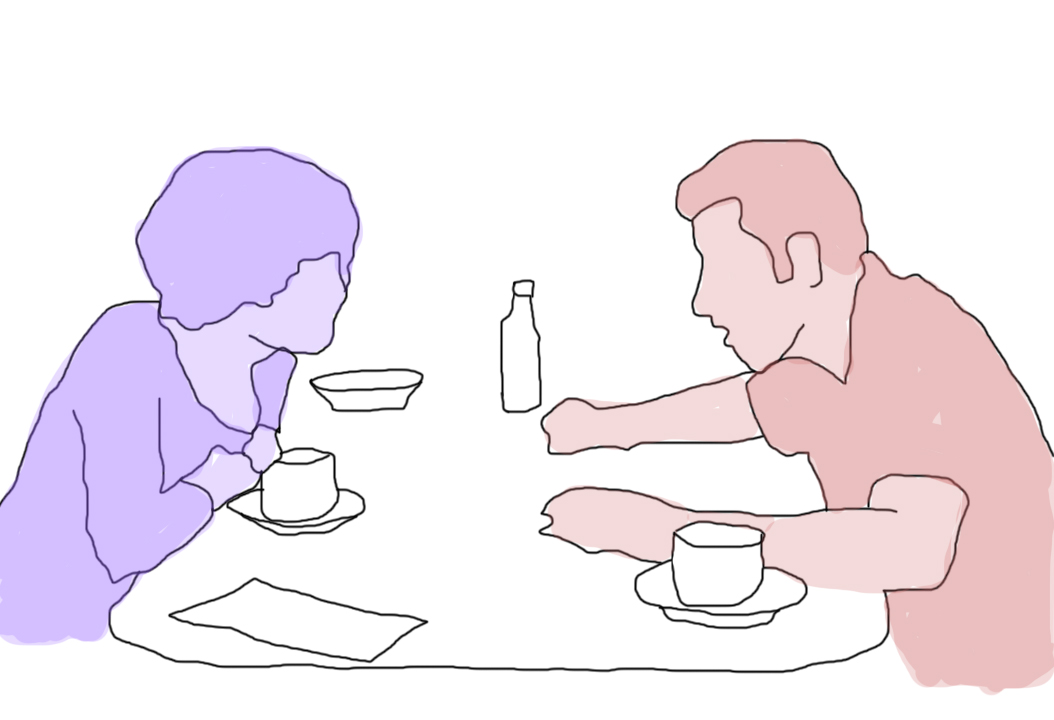
• Honeybunny & Pumpkin – The diner bandits
Process and Data Prep:
All data prep and analysis were performed in R.
Downloaded raw script as a txt file from:
http://www.dailyscript.com/scripts/pulp_fiction.html
Data was in a dreadful format being the actual script, a lot of blank spaces, character lines being split over several rows, character actions and scene cuts included.

The ideal format was to be three columns, first column being character name, second being which number line it was, and thirdly the character’s entire spoken line. This would make it very easy to do exploratory analysis in Tableau and eventually push into a Markov model to display the character networks and interactions, as seen below.
A lot of data munging was done to the data to get to this format.

Enter Tableau for some quick insights!
Exploratory Analysis:

Our top characters appear to be Vincent, Jules and Butch with the highest word count and lines. The orange circles show total word count for the film, the blue bars show total lines for the film, the dark blue bars identify main characters as listed in IMDB synopsis. We can see that Jules actually says more than Vincent but has fewer lines.

Captain Koons, a friend of Butch’s Dad (played by Christopher Walken), has the longest single line: “This watch I got here was first purchased by your great-granddaddy…” 428 words

Jules’ famous dialogue takes second place: “There’s a passage I got memorized. Ezekiel 25:17. “The path of the righteous man…”” 243 words

The smallest verbal role with only one line and one word fittingly goes to The Gimp: “Huhng?” – The Gimp, 1994.
A timeline of lines by each character

The blocks of various colours show the scenes involving each character. A lot of purple throughout for Vincent and Jules. We can see that even though Butch is a main character, he doesn’t appear until about half way through the film with his lighter blue colour.
Network Investigation:
We now have an idea that Vincent, Jules and Butch are the main characters and there appear to be a few sub-plots going on, however can we validate this further using data science?
Next up we transform the data into a transition matrix/heatmap.

This heatmap displays total number of interactions between each character, the darker spots representing the more common interactions. The left-hand side represents a character that has just said a line and the top side represents who responded to that character.
We can see Vincent and Jules have the most interactions (108 and 110) and Butch and Fabienne (his wife) also have a large amount of back and forth interactions (78 and 79).
Looking horizontally, we see that Jules and Vincent interact with the largest variety of characters, having the highest number of dark squares with other characters.
This is a nice way to quickly highlight more interesting relationships.
Markov Chain:
“A stochastic model describing a sequence of possible events in which the probability of each event depends only on the state attained in the previous event.“
It is a way to describe the changing of states, frequently used in online user behaviour, attribution modelling and obviously film script analysis.

This is a map of all character interactions. Each node is a character with the vertices being the transition probabilities of interaction which could also be interpreted as the strength of the relationship between two characters. I have removed any transition value less than 0.05 to help keep the plot tidy.
The existence of a vertex between two nodes signifies that the two characters have had some level of verbal interaction during the film.
Vincent, Jules and Butch all have the highest level of interactions with other characters (they have the most vertices linked to other nodes) making them the most likely main characters.
Marsellus and English Dave (Club owner for Marsellus) are the two characters that bring Vincent, Jules and Butch together.
Butch and Fabienne can be seen to be close as their transition probabilities to each other are 0.57 and 0.88. The same applies to Honeybunny and Pumpkin, with their transition probabilities of 0.75 and 0.51.
The existence of smaller sub-networks suggest side-stories within the film. Butch vs Jules and Vincent, Mia and Vincent, Butch, Zed and Maynard.
A more fully connected Markov chain with fewer main characters might suggest the opposite of this.

Conclusions:
After much data munging, prepping, exploratory analysis and machine learning, the machine did indeed successfully discover the three main points we set out to find:
• Key characters are clearly Vincent, Jules and Butch however Marsellus is the pivotal character which joins the parties together
• There are several different relationships seen throughout the movie; the strongest being between Pumpkin and Honeybunny, and Butch and Fabienne
• The existence of subplots suggested by appearance of detached networks of character interactions
o Butch vs. Vincent and Jules
o Vincent and Mia
Final notes:
One sadistic chap after the BIMA presentation suggested looking at the entirety of Game of Thrones and running a similar analysis. If anybody has a couple of spare months, this would be an incredible piece!
About the author
Nick Mottershead
Nick Mottershead studied Mathematics and Statistics at the University of Auckland as part of a BSC in Finance. Topics studied include time series analysis, regression, applied stochastic modelling, and financial mathematics.
Nick joined Lynchpin in 2017 and has worked across a breadth of projects, including forecasting, marketing attribution, segmentation, and cross-sell.
Specialising in R, Nick has led many successful data science projects by connecting commercial and financial reasoning with skilled analytics expertise to deliver outcomes focused on commercial success and actions.

